Knowledge in Action
Numbers That Tell a Story
Verified, independently monitored impact data across all FKLM Africa Foundation pillars and field projects.
Pillar Impact
Impact Breakdown by Pillar
Each pillar operates with defined metrics, verified annually through independent monitoring.
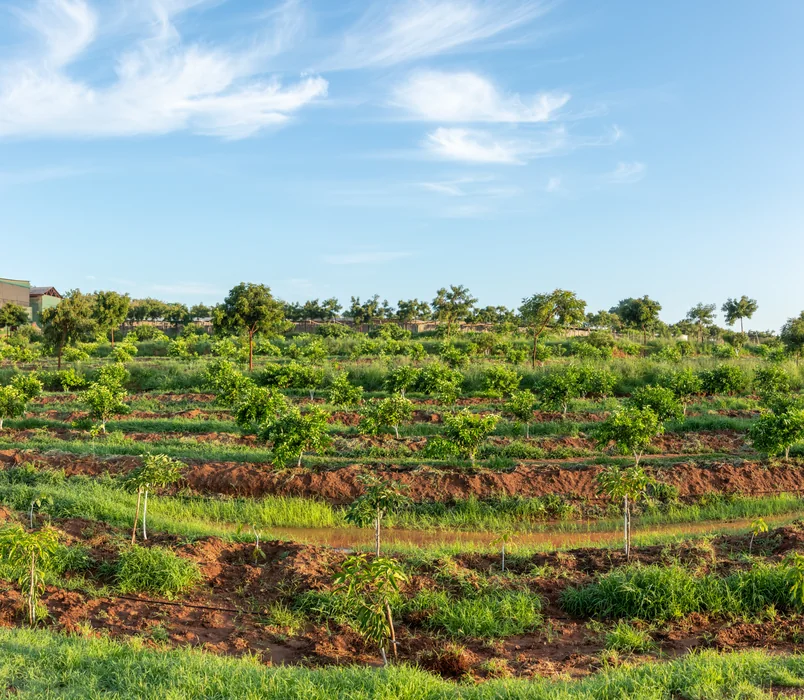
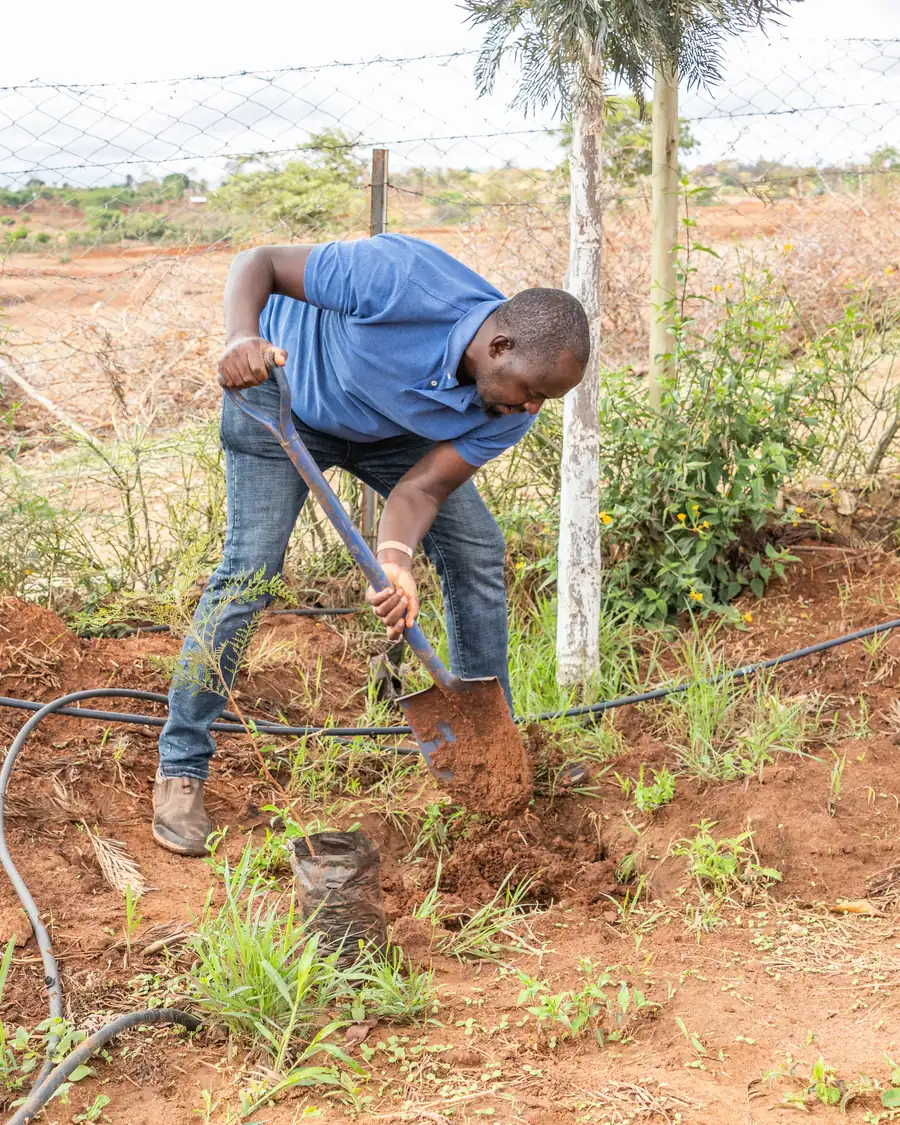
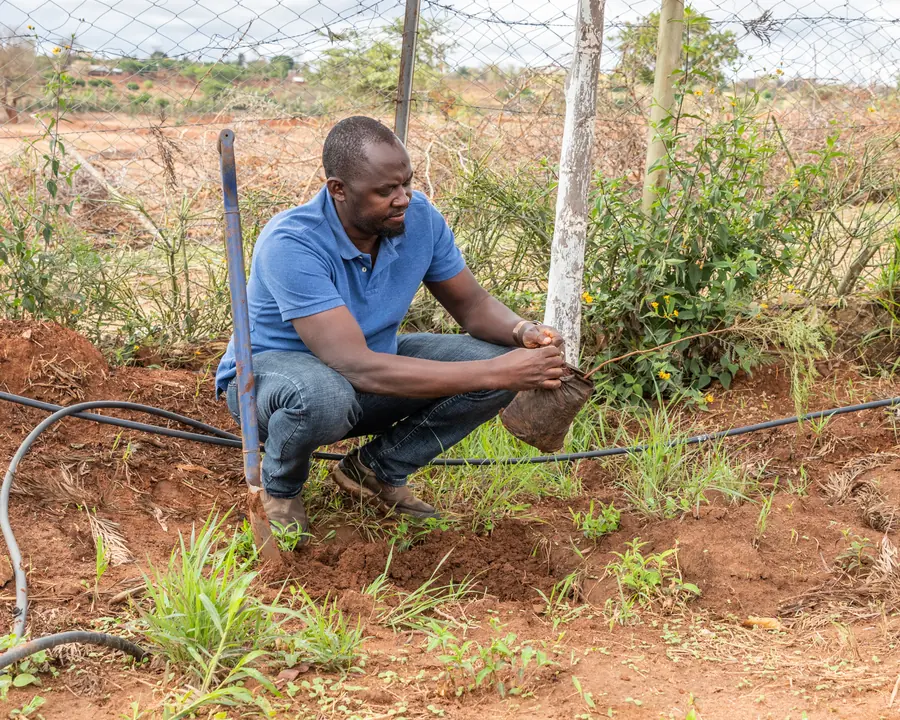
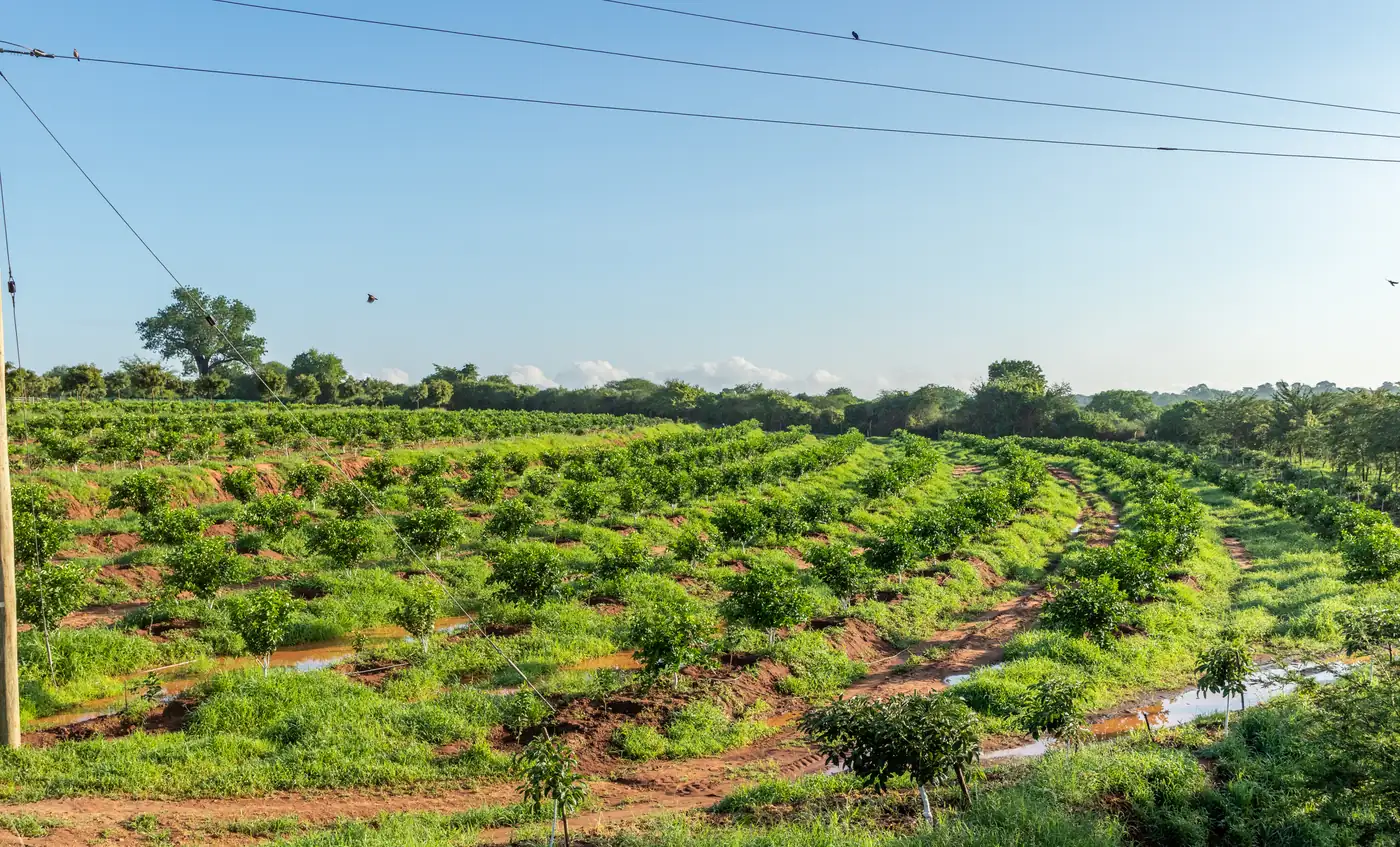
Climate & Ecosystem Restoration
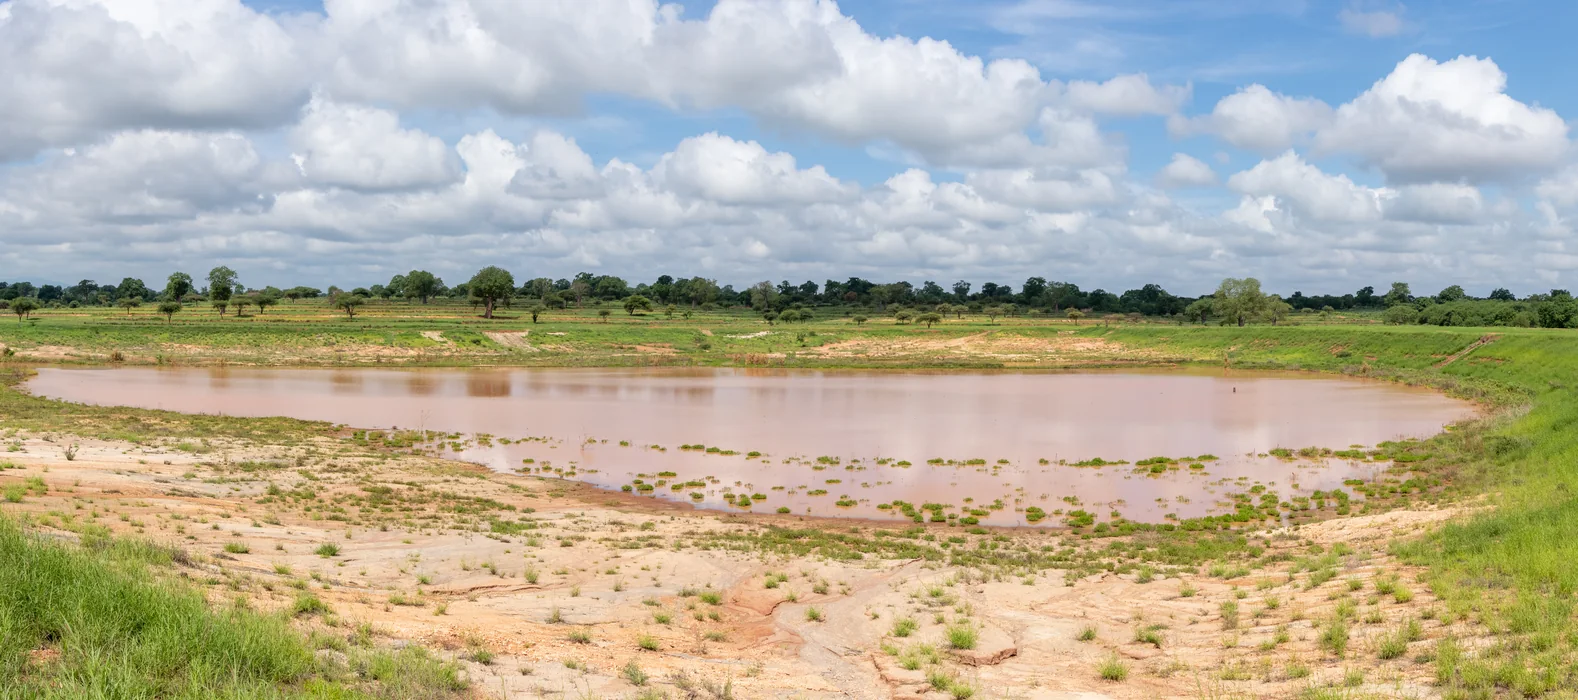
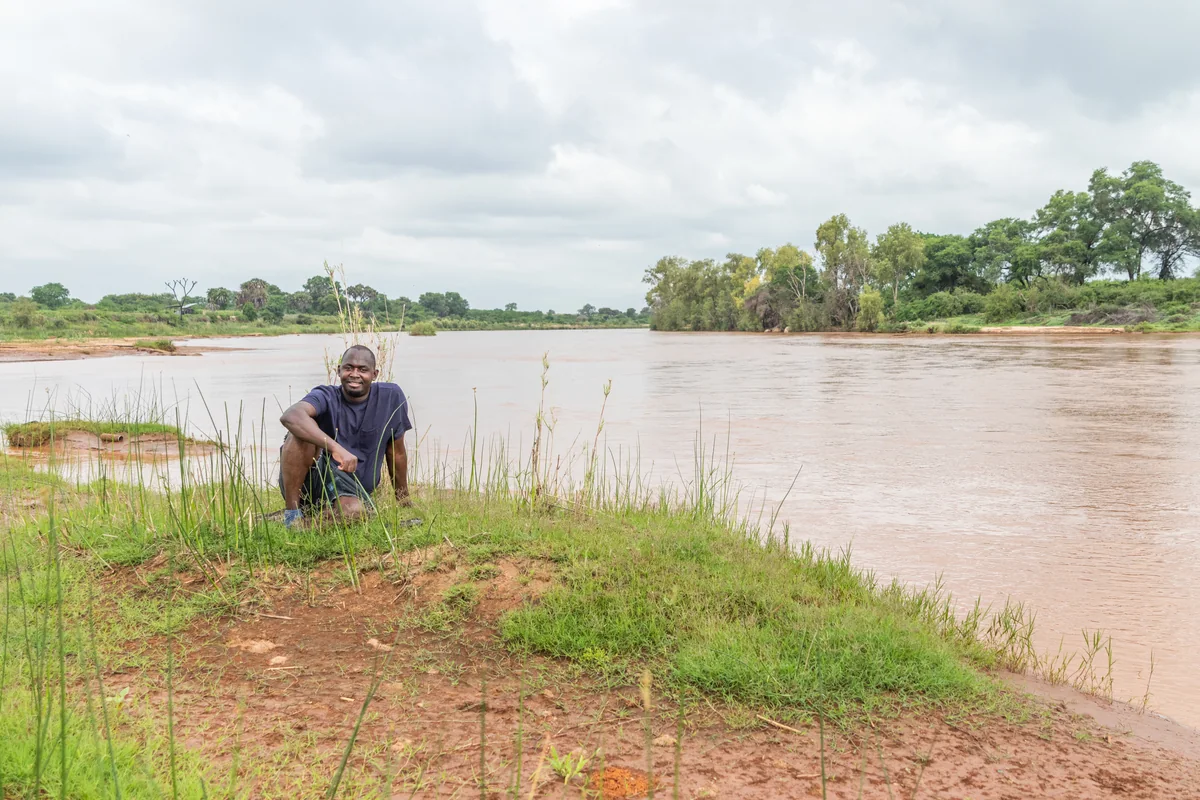
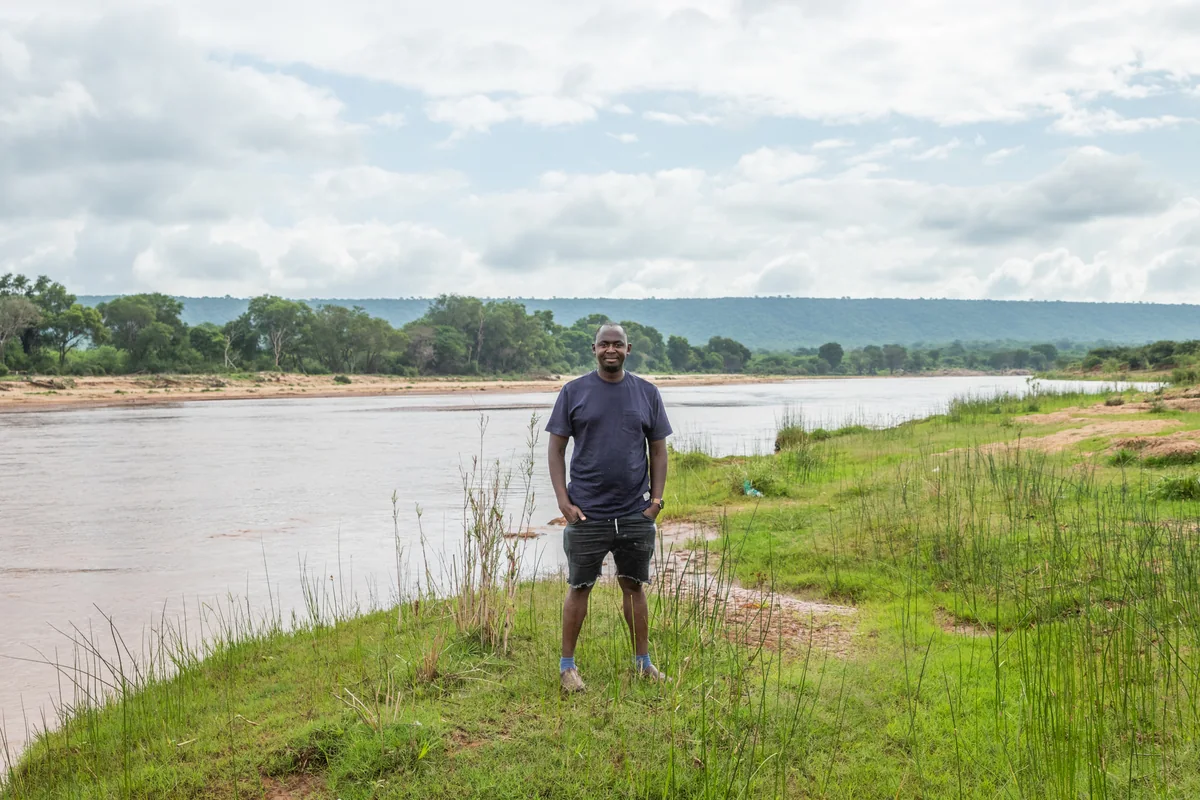
Water Security & Infrastructure
Carbon & Environmental Intelligence
Youth & Women Empowerment
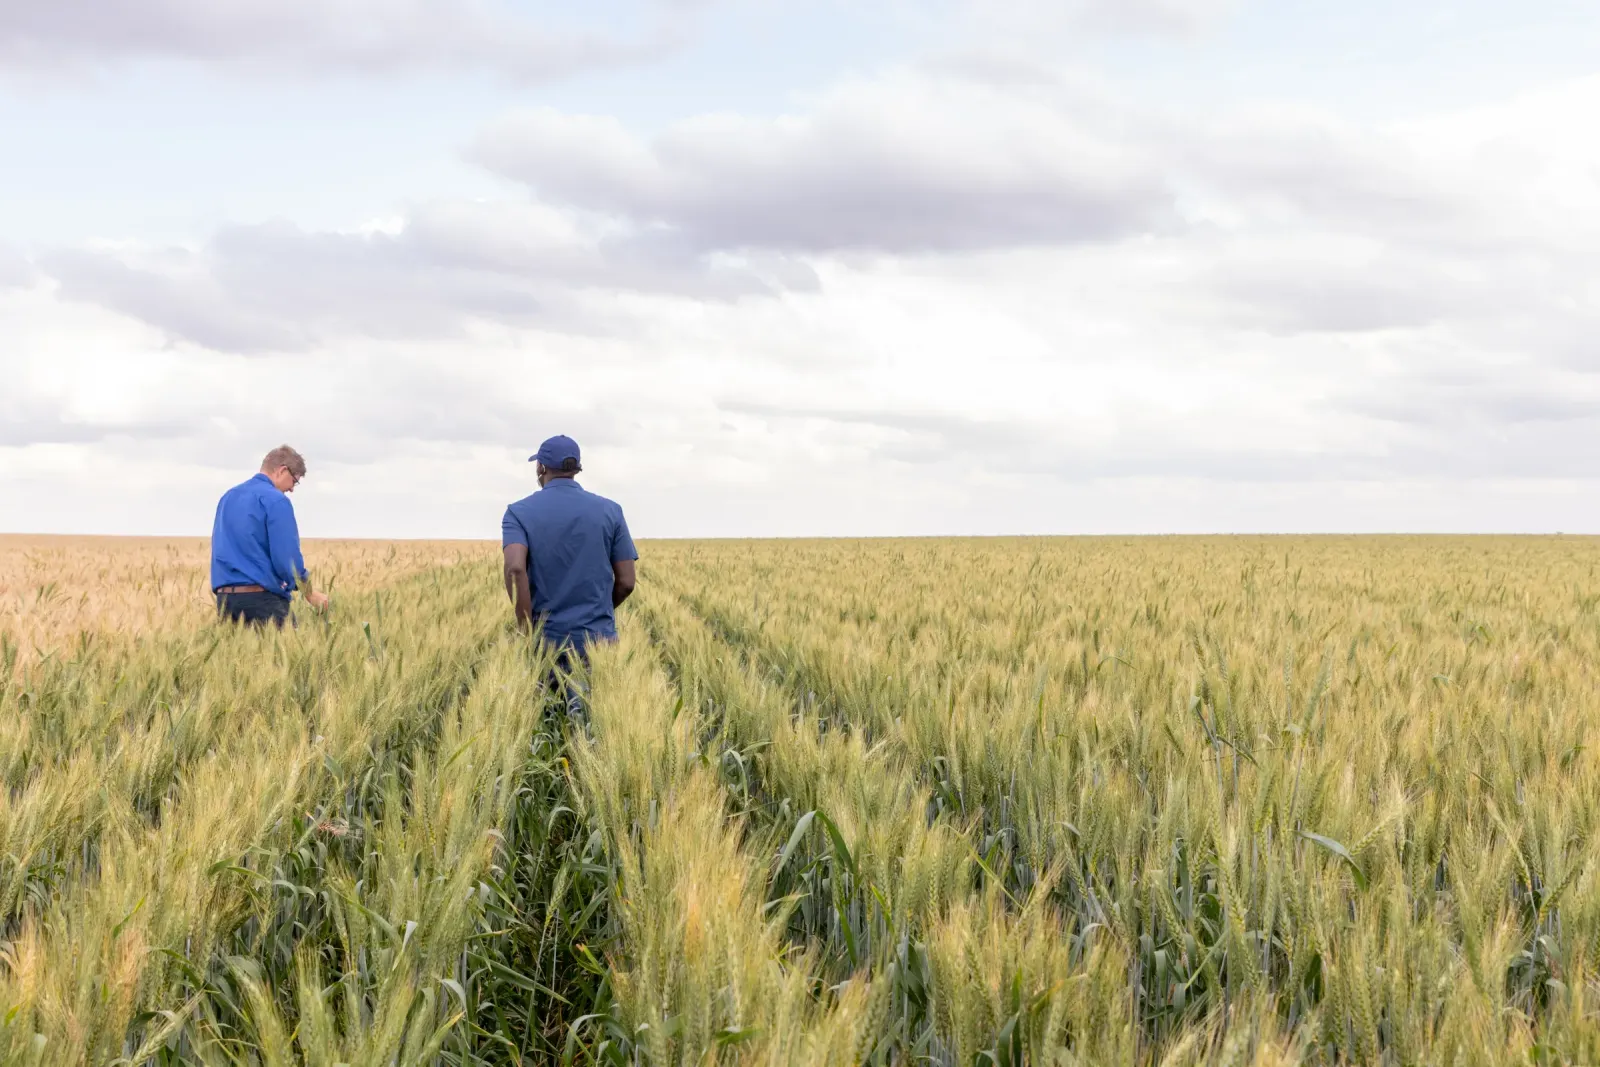
Community Livelihoods & Agriculture
Geographic Reach
Where We Work
Active pillars and field projects across FKLM Africa's core operating countries, with flagship delivery and platform growth advancing in parallel.


Growth Over Time
Our Journey in Numbers
Six years of compounding ecological and community impact.
| Year | Trees Planted | Hectares Restored | Communities |
|---|---|---|---|
| 2018 | 120,000 | 340 | 4 |
| 2019 | 280,000 | 820 | 9 |
| 2020 | 420,000 | 1,800 | 14 |
| 2021 | 680,000 | 3,600 | 21 |
| 2022 | 1,100,000 | 6,400 | 34 |
| 2023 | 1,800,000 | 9,200 | 42 |
| 2024 | 2,400,000 | 12,400 | 48 |
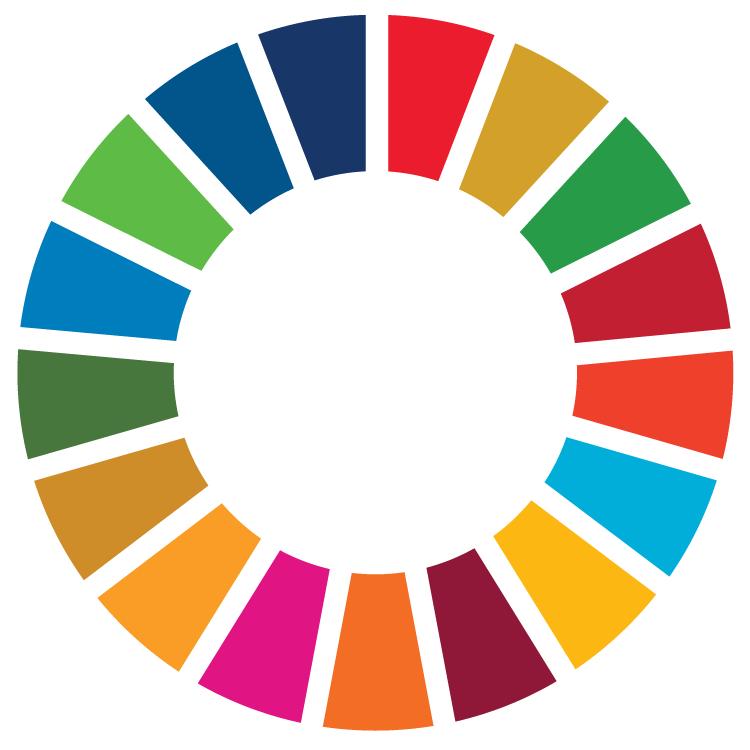
SDG Contribution
Progress Against Global Goals
Self-assessed pillar contribution against Sustainable Development Goals, updated annually.
Featured Projects
Impact in Action
Katothya/Yondoni Sand Dam
Wamunyu & Muthetheni Wards, Machakos County, Kenya
Nyagatare Regenerative Enterprise Hubs
Nyagatare District, Rwanda
Deepen Our Impact
Fund Verified Impact. Support Evidence-Based Restoration.
Every contribution is directed to pillars with defined metrics, independent monitoring, and published results.